On this page
A slow dashboard can lose a customer’s confidence before an error ever appears. The useful first question is where the request spends its time: waiting for a connection, running SQL, serializing data, crossing the network or rendering the screen.
This guide gives founders and engineers a way to investigate eight common causes. It does not promise a percentage improvement. The result depends on the actual workload, data distribution and deployment. The SQL examples are illustrative and should be adapted to your schema and measured before rollout.
Establish a baseline you can compare
Pick one important screen and a representative account. Record the request duration, query count, slowest statements, response size and browser waterfall. Include a large account and a deep page where applicable; an empty development database can hide the problem.
Separate cold starts from warm requests and note concurrent activity. Use the same inputs before and after a change. A fast isolated query does not establish that the page is fast under normal traffic.
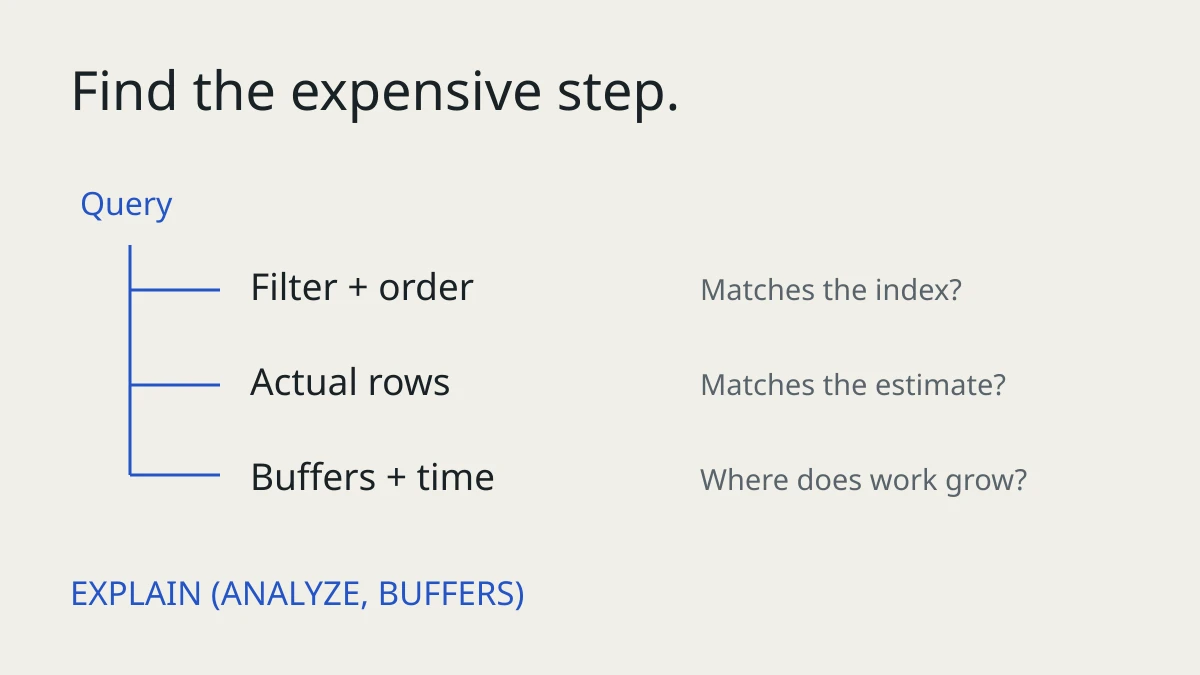
For a slow SELECT, inspect the plan with EXPLAIN (ANALYZE, BUFFERS). PostgreSQL’s EXPLAIN guide explains estimates and actual execution. ANALYZE executes the statement, so use an appropriate environment and workload limits. Exercise particular care with statements that write data or call functions with side effects.
1. Repeated queries for related records
A list can run one query for its rows and additional queries for each row’s related data. For an illustrative 50-row list with two extra queries per item, that becomes 101 queries. The important evidence is repetition and accumulated time, not a universal query-count threshold.
Batch related lookups, use appropriate joins or use your ORM’s relationship-loading facilities. Check response correctness after changing the loading strategy: joining several one-to-many relationships can multiply rows and inflate aggregates.
Verify that the query count stays bounded as the list grows. Also measure how many fields and related records are loaded; replacing many small queries with an unnecessarily huge result can create another problem.
2. Indexes that do not match the query
Suppose a dashboard filters by organization and status, then lists the newest orders. A candidate index might support that filter and ordering together:
CREATE INDEX idx_orders_org_status_created_id
  ON orders (org_id, status, created_at DESC, id DESC);
Treat this as a hypothesis. Inspect the actual plan and existing indexes before adding it. Column order, filter selectivity and data distribution matter. A sequential scan can be the right choice when the query needs much of a table.
Indexes also consume storage and add write overhead. PostgreSQL’s index documentation and multicolumn guidance explain these tradeoffs. Plan index creation with the table’s write activity and operational constraints in mind.
3. Exact counts that the interface does not need
If every request computes an exact result count before displaying a short list, the count may dominate the response. Confirm that in the trace before changing it.
Ask what decision the number supports. A financial reconciliation may need an exact total. A browsing interface may only need to know whether another page exists. A cached or approximate count can work when it is clearly described and its freshness is acceptable.
Counters maintained on writes introduce consistency and repair work. A cache needs an expiry or invalidation strategy. Choose the simplest approach that preserves the meaning the user expects.
4. Deep OFFSET pagination
Large offsets require the database to work through skipped rows. Cursor pagination can avoid much of that work when the query and index support it. Use a stable ordering with a unique tie-breaker:
SELECT id, created_at, status
FROM orders
WHERE org_id = :org_id
  AND status = :status
  AND (created_at, id) < (:last_created_at, :last_id)
ORDER BY created_at DESC, id DESC
LIMIT 50;
The first-page query omits the cursor predicate. This example assumes non-null ordering fields and a cursor produced from the last displayed row. Keep the tenant and filter constraints on every page, and validate the cursor input.
Cursor pagination changes navigation: arbitrary page-number jumps become less natural, and changing the sort requires a different cursor. It is not a guarantee that every page has identical latency. Measure representative pages and document behavior when records change between requests. PostgreSQL’s LIMIT and OFFSET documentation describes the underlying considerations.
5. Recomputing the same expensive aggregate
A chart may scan a long order history each time someone opens it. If the data can be slightly delayed, consider a summary table or a materialized view with an appropriate refresh process.
Agree the freshness requirement first. “Updated five minutes ago” may be acceptable for an operational trend and unacceptable for a decision requiring current balances. Handle corrections, backfills, time zones and failed refreshes explicitly.
The goal is to move repeated work to a controlled process without changing the meaning of the result. Keep a way to reconcile the summary against its source data.
6. Loading fields the screen never uses
Wide text, JSON and unused relationships can add database, transfer and serialization work. Select the fields needed by the screen and measure the response size before and after.
A narrower response does not imply a proportional improvement in total latency; SQL execution or frontend work may still dominate. Watch for deferred-field loading in ORMs, which can reintroduce extra queries when code accesses a field you omitted.
Check both the backend response and the browser. The user experiences the complete loading path.
7. Connection pressure and waiting
Measure time waiting for a connection separately from time executing a query. Bursts of application instances, overly large pools and long-running transactions can exhaust capacity even when individual statements look reasonable.
Configure runtime pooling for the hosting environment and driver. Verify compatibility with transaction pooling, prepared statements and any session-level features you use. Migration and maintenance connections have different requirements from ordinary request traffic.
Do not increase every pool size at once. Estimate total potential connections across instances and keep enough capacity for operational work. Read the provider’s current connection guidance before changing deployment settings.
8. Sequential requests and frontend work
Sometimes several independent requests run one after another because of the UI’s loading structure. Parallelize genuinely independent work or shape a server response around what the screen needs. Keep the total work and connection budget in view: unrestricted concurrency can overload the database.
If data arrives quickly but the screen remains slow, inspect rendering, large tables and client-side transformations. Pagination or virtualization may matter more than another SQL index. Avoid loading an entire history to draw a chart that needs only a compact summary.
Turn the investigation into a bounded fix
A useful performance review should name the slow path, show comparable before-and-after evidence and describe the rollout and rollback. Record representative latency, query count, payload size, relevant plans and any changed freshness or navigation behavior.
Fix the largest measured contributor, verify correctness, then measure again. Stop when the important user journey meets its agreed budget; speculative changes can make a working system harder to operate.
For an assessment, describe the slow screen and include the approximate data size, hosting setup and conditions that reproduce the delay. A sanitized query plan or request trace helps; credentials and customer records do not belong in an initial inquiry. You can also review my backend and API engineering service.
Need this built?
These services can turn the ideas in this article into production software.