On this page
A founder messaged me last year with a sentence I have heard many times: "Our site feels slow, our developer says it's fine, and I don't know who to believe." We looked at it together. The homepage shipped four megabytes of JavaScript, loaded fonts from three different services, and the server took two full seconds to even start responding. Nobody had lied to her. The site worked. It was just quietly bleeding visitors.
Speed is one of those problems that hides in plain sight, because the people who build a site experience it on fast laptops with warm caches, while real visitors experience it on mid-range phones over mobile networks. This article is the guide I wish I could send everyone who suspects their site is slow: how to find out for sure, what actually causes it, and what fixing it looks like, in plain English, whether or not you write code.
Why this is worth your attention at all
Speed is not a vanity metric. It shows up in three places that affect your business directly.
Visitors leave. The relationship between load time and abandonment is well documented and brutal. Every extra second of waiting peels off a slice of your traffic before they see a single word. On mobile, where most traffic lives now, the effect is stronger.
Google notices. Search ranking includes page experience signals, the Core Web Vitals. A slow site is not disqualified, but when you and a competitor have similar content, speed is a tiebreaker you are losing. Slow pages also get crawled less efficiently, which matters as your site grows.
Conversions sink. Retail studies keep finding the same shape: faster pages sell more. The reason is mundane. Every moment of jank, every layout jump, every unresponsive tap erodes the feeling that a site is trustworthy, and people do not type card numbers into sites that feel broken.
First, measure. Do not guess.
Before touching anything, get numbers. Two free tools give you almost everything.
PageSpeed Insights (pagespeed.web.dev): paste your URL, and read the top section first. That top section is field data, meaning measurements from real Chrome users who visited your site, and it is the closest thing to ground truth that exists. The lab score below it is a simulation, useful for diagnosis, not gospel.
Your own phone, on mobile data. Open your site in a private tab with wifi off. This thirty second test defeats every "works on my machine" argument ever made, because you are holding what your visitors are holding.
When you read the reports, three numbers matter most, and they map to plain questions:
| Metric | The question it answers | Good |
|---|---|---|
| LCP, Largest Contentful Paint | How long until the main content is visible? | Under 2.5s |
| INP, Interaction to Next Paint | When I tap or click, does it respond? | Under 200ms |
| CLS, Cumulative Layout Shift | Does the page jump around while loading? | Under 0.1 |
If your field data is green on all three, close this article and go work on something else; your problem is not speed. If it is not green, keep reading, because the causes are remarkably predictable.
The usual suspects, in the order I find them
After years of performance audits, I can tell you the same handful of problems account for nearly everything.
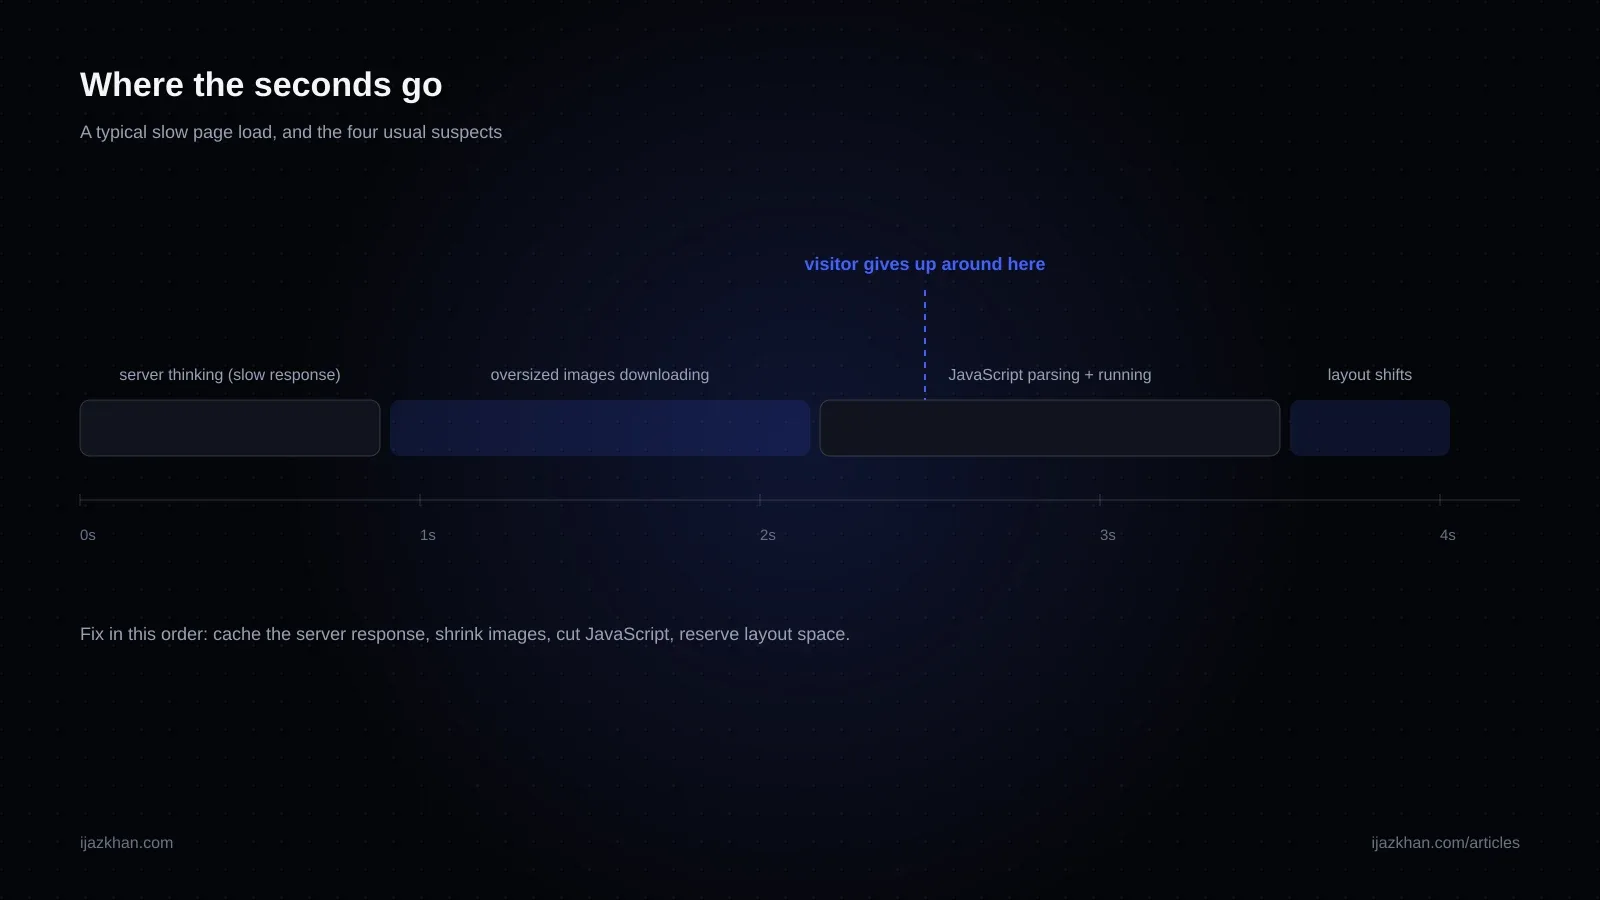
1. Images that are far bigger than they need to be. Still the number one cause on content and e-commerce sites. A 4000 pixel photo squeezed into a 400 pixel card, PNG files doing a JPEG's job, hero images in decade-old formats. The fix is mechanical: modern formats like WebP or AVIF, sized close to their display size, compressed properly, and lazy loaded when below the fold, while the hero image is prioritized. Frameworks can automate all of this; Next.js does it with its image component, and the difference on image-heavy pages is dramatic.
2. Too much JavaScript. The modern web's signature disease. Every feature, tracker, and widget adds script, and script is the most expensive thing you can send to a phone, because the phone must download it, parse it, and run it before the page becomes responsive. This is what makes sites feel janky even after content appears, and it is the main driver of bad INP scores. The fix is less glamorous than the cause: remove what you do not use, load third party scripts after the page is interactive, split code so each page carries only what it needs, and render on the server so the browser starts with finished HTML instead of assembly instructions.
3. A slow first response from the server. Everything else waits behind this. If the server takes 1.5 seconds to begin responding, no frontend heroics can save you. Common causes: cheap shared hosting, a server on another continent, no caching so every visit rebuilds the page from scratch, and slow database queries hiding under the homepage. Two fixes carry most of the weight: put a CDN in front of the site so repeat content is served from near the visitor, and cache aggressively so most requests never touch the database at all. Pages that change rarely should be pre-built, not rebuilt per visitor. And when the server is genuinely slow doing its work, the cause is usually the database; I wrote a whole article about the PostgreSQL fixes that cure most slow dashboards.
4. Third party scripts you forgot you added. Chat widgets, heat maps, five analytics tools, A/B testing snippets, marketing pixels installed for a campaign that ended two years ago. I audited a site that loaded 41 third party scripts; nobody at the company could say what a third of them did. Each one is code you do not control on a server you do not control. Audit them twice a year, delete freely, and demand that survivors load late and asynchronously.
5. Fonts and layout shift. Custom fonts that block text from appearing, images without reserved dimensions, banners that inject themselves at the top and shove everything down. Layout shift is the reason you tap one button and hit another, and it reads as broken. Fixes: self-host one or two font files with sensible fallback behavior, always give images explicit dimensions so the browser reserves space, and never inject content above existing content after load.
6. Bloated themes and page builders. Specific to the WordPress and site-builder world: multipurpose themes that load twelve sliders and three icon libraries on every page because some page somewhere might use them, plus a plugin pile accumulated over years. Sometimes optimization plugins genuinely help. Past a point, a rebuild on a lean foundation is cheaper than archaeology on the theme.
What a real fix looks like
A performance project, done properly, follows a boring and reliable arc.
First, measure and diagnose: field data, lab traces, and a list of specific causes ranked by impact. Never start with solutions; a site with a slow server does not need an image pipeline first.
Second, take the big wins in order. There is a strong power law here. Typically two or three fixes, usually images, script reduction, and caching, deliver most of the improvement, and twenty small tweaks deliver the rest. When I rebuilt my own site, the two decisive moves were pre-rendering pages and deferring every decorative script until after the content painted; the WebGL animation you can see on my homepage now costs the initial load almost nothing.
Third, and this is the step everyone skips: install a guardrail so it does not creep back. Speed regressions happen one innocent decision at a time, a new tracking script here, an unoptimized upload there. The durable fix is a performance budget checked automatically, plus a habit of looking at field data monthly. Fast sites are not sprinted into existence; they are kept fast.
Notice what is absent from this list: switching hosting providers in anger, buying a "speed up your site" plugin bundle, or rewriting everything in this year's framework. Occasionally a rebuild is justified, but it should be a diagnosis-driven conclusion, never the opening move.
How fast is fast enough?
You do not need to win benchmarks. You need field data comfortably in the green: main content visible within about two and a half seconds for typical mobile visitors, interactions responding within about two hundred milliseconds, and a page that does not shuffle while loading. Past that, returns diminish quickly, and your energy is better spent on content and product.
Getting there is rarely a mystery and rarely a monster project. Most sites I audit have two to four specific, fixable problems whose repair transforms the experience within a couple of weeks.
If your site is the patient and you want a diagnosis rather than a guess, this is part of what I do: performance audits and fixes on real production sites, from full stack rebuilds to targeted backend and database work. Send me your URL and I will tell you honestly whether you have a two-day problem, a two-week problem, or no problem at all.
Quick answers
Will more expensive hosting make my site fast? Only if a slow server was your actual problem, and it usually is not the only one. Measure first. Upgrading hosting to fix oversized images is paying rent on a bigger garage because your car will not start.
Do I need to rebuild my site? Usually no. Most slow sites are fixable in place. Rebuilds make sense when the platform itself is the ceiling, an ancient theme, a builder that emits bloat you cannot remove, or an architecture that cannot render server side and needs to.
Is my WordPress site doomed to be slow? No. Lean theme, few plugins, good caching, and an image pipeline make WordPress genuinely quick. The doom comes from the accumulation habit, not the platform.
How do I check my competitors' speed? Run their URLs through PageSpeed Insights, exactly like your own. If your field data is green and theirs is not, you hold a small quiet ranking advantage on every comparison search you both appear in.
How often should I re-check? Glance at field data monthly, and re-test after anything significant ships: a redesign, a new marketing tool, a platform update. Regressions caught in the same month they appear take minutes to trace. The ones discovered a year later take days.
Need this built?
These services can turn the ideas in this article into production software.